Objectives:
- To gain an understanding of progressive waves; longitudinal and transverse waves;
(i) Displacement, amplitude, wavelength, period, phase difference, frequency and speed of a wave;
(ii) Techniques and procedures used to use an oscilloscope to determine frequency - To select and use the equation
- To select and use the wave equation
- To be able to draw and extract data from graphical representations of transverse and longitudinal waves


The Anatomy of a Wave
A transverse wave is a wave in which the particles of the medium are displaced in a course perpendicular to the direction of energy transport. A transverse wave can be created in a rope if the rope is stretched out horizontally and the end is vibrated back-and-forth in a vertical direction. If a snapshot of such a transverse wave could be taken so as to freeze the shape of the rope in time, then it would look like the following diagram.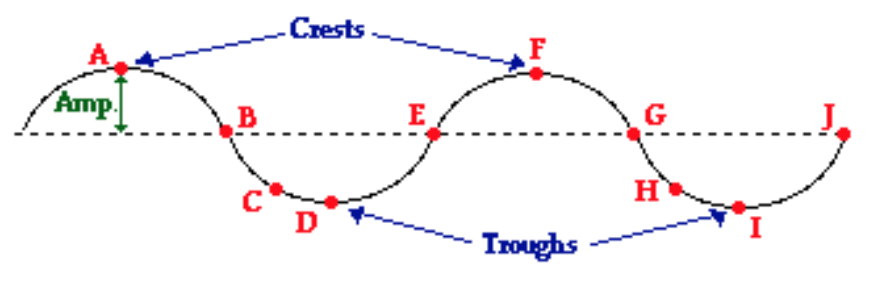
The dashed line drawn through the centre of the diagram represents the equilibrium, or rest, position of the string. This is the position that the string would assume if there were no disturbance moving through it. Once a disturbance is introduced into the string, the particles of the string begin to vibrate upwards and downwards. At any given moment in time, a particle on the medium could be above or below the rest position. Points A and F on the diagram represent the crests of this wave. The crest of a wave is the point on the medium which exhibits the maximum amount of positive or upwards displacement from the rest position. Points D and I on the diagram represent the troughs of this wave. The trough of a wave is the point on the medium which exhibits the maximum amount of negative or downwards displacement from the rest position.
The wave shown above can be described by a variety of properties. One such property is amplitude. The amplitude of a wave refers to the maximum amount of displacement of a a particle on the medium from its rest position. In a sense, the amplitude is the distance from rest to crest. Similarly, the amplitude can be measured from the rest position to the trough position. In the diagram above, the amplitude could be measured as the distance of a line segment which is perpendicular to the rest position and extends vertically upward from the rest position to point A.
The wavelength is another property of a wave which is portrayed in the diagram above. The wavelength of a wave is simply the length of one complete wave cycle. If you were to trace your finger across the wave in the diagram above, you would notice that your finger repeats its path. A wave has a repeating pattern. And the length of one such repetition (known as a wave cycle) is the wavelength. The wavelength can be measured as the distance from crest to crest or from trough to trough. In fact, the wavelength of a wave can be measured as the distance from a point on a wave to the corresponding point on the next cycle of the wave. In the diagram above, the wavelength is the horizontal distance from A to F, or the horizontal distance from B to G, or the horizontal distance from E to J, or the horizontal distance from D to I, or the horizontal distance from C to H. Any one of these distance measurements would suffice in determining the wavelength of this wave.
A longitudinal wave is a wave in which the particles of the medium are displaced in a direction parallel to the direction of energy transport. A longitudinal wave can be created in a slinky if the slinky is stretched out horizontally and the end coil is vibrated back-and-forth in a horizontal direction. If a snapshot of such a longitudinal wave could be taken so as to freeze the shape of the slinky in time, then it would look like the following diagram.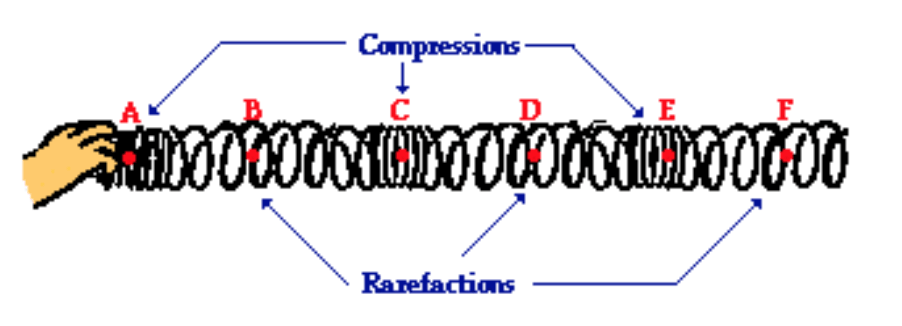
Because the coils of the slinky are vibrating longitudinally, there are regions where they become pressed together and other regions where they are spread apart. A region where the coils are pressed together in a small amount of space is known as a compression. A compression is a point on a medium through which a longitudinal wave is travelling which has the maximum density. A region where the coils are spread apart, thus maximizing the distance between coils, is known as a rarefaction. A rarefaction is a point on a medium through which a longitudinal wave is travelling which has the minimum density. Points A, C and E on the diagram above represent compressions and points B, D, and F represent rarefactions. While a transverse wave has an alternating pattern of crests and troughs, a longitudinal wave has an alternating pattern of compressions and rarefactions.
As discussed above, the wavelength of a wave is the length of one complete cycle of a wave. For a transverse wave, the wavelength is determined by measuring from crest to crest. A longitudinal wave does not have crest; so how can its wavelength be determined? The wavelength can always be determined by measuring the distance between any two corresponding points on adjacent waves. In the case of a longitudinal wave, a wavelength measurement is made by measuring the distance from a compression to the next compression or from a rarefaction to the next rarefaction. On the diagram above, the distance from point A to point C or from point B to point D would be representative of the wavelength.
Deducing and using the wave equation
Justification/deduction of the wave equation
Lets use an example of the coaches of a train are going past; 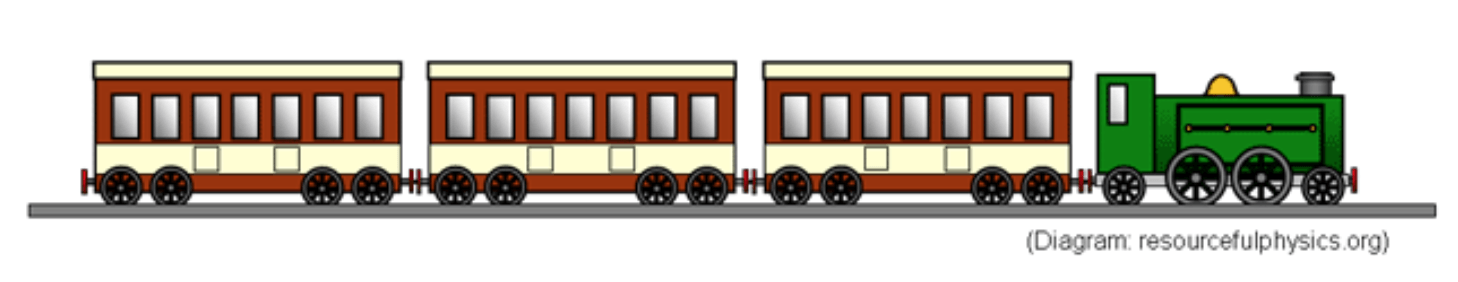 You count how many coaches go by in a second and you know the length of one – so you multiply the two together to get the train’s speed.
Apply this to waves: count the number of waves passing each second (= frequency), and multiply by the length of each (= wavelength) to find the speed.


This equation becomes:

for the speed of light, c.
You need to be able to select, use and rearrange this equation to find either  


Using an Oscilloscope
Click on the image above for a link on how to use an oscilloscope.
You need to learn about the 

An oscilloscope is acts in a similar way to a voltmeter that shows you how voltage varies with time, it plots a voltage against time graph on the screen.
An oscilloscope s connected in parallel to the component you are looking at (like a voltmeter).
Instead of getting a digital readout (as on a multimeter) it gives you a graph.
- The y-axis is voltage (so you can see how many volts are across the component).
- The x-axis is time (so you can see whether the voltage is steady (D.C.) or varying (A.C.))
This is most useful when you look at AC voltages.
For more information use the following link – cyberphysics
Oscilloscopes can be tricky devices to use, but the more your practice using them the easier they become to use.
Further reading:
- Isaac Physics – Waves – This is a reading resource
- Research the methods of earthquake detection throughout history.
- http://www.physicsclassroom.com has a good internet tutorial called The Anatomy of a Wave.
- Research phasor notation of waves.
- Physics of Waves by William C. Elmore and Mark A. Heald – preview
- Research the operation of radar and sonar.
- Research the design of stringed musical instruments and the ways in which different notes are produced by them.
You must be logged in to post a comment.