When taking a measurement there are a few terms that are very useful to be able to describe this measurement, to say whether it was precise or not, if there was an error in the experiment etc.
Accuracy
A measurement result is considered accurate if it is judged to be close to the true value. A quality denoting the closeness of agreement between a measured value and the true value. It is not quantifiable but can be stated as more or less accurate.
Repeatability 
Precision obtained when measurement results are produced in one laboratory, by a single operator, using the same equipment under the same conditions over a short timescale. A measurement is repeatable in quality when repetition under the same conditions gives the same or similar results (for example when comparing results from the same pupil or group using the same method and equipment).
Uncertainty
Uncertainty is the interval within which the true value can be expected to lie. Whenever a measurement is made, there will always be some uncertainty or doubt about the result obtained. It can be expressed in terms of standard deviations or other estimate of spread (for example the range of values obtained). Sources of variation in the data collected include contributions from both random and systematic effects.
Uncertainty can also be estimated by understanding the instruments used (for example, typically the uncertainty might be estimated as plus or minus half the smallest scale division. In the case of a little ruler, the measurement may be like 
When dealing with uncertainty in graphs, for example calculating the gradient, first of all, error bars should be drawn. These error bars are little lines that extend from the point plotted to identify how much larger or smaller that data plot could have been if considered the fact that the instrument had an uncertainty. For example if the ruler had a 

which gives you the uncertainty in the value of the gradient.
Percentage uncertainty
When doing a measurement, you may want to calculate the percentage uncertainty, which gives a value of how much off a true value your experimental data is. The equation to find the percentage uncertainty is:

You can also calculate the percentage uncertainty by dividing the absolute uncertainty by the value. For example, in a reading of the measurement such as

The percentage error is a measure of uncertainty that is irrelevant of the size of the object. For example if you have to lay a road, you may have an error of a meter. You may think that this error is a lot more than an error of one centimetre, but really because the road is many kilometres in length, it may be that the error is negligible, while the error of a centimetre in a measurement of 
Precision
Precision is a quality denoting the closeness of agreement between values obtained by repeated measurements. It depends only on the extent of random effects, it gives no indication of how close results are to the true value, but only how close they are between each other. A measurement is precise if values cluster closely.
Measurement errors
A measurement error is the difference between a measured value and the true value of a physical quantity being measured, where a true value is thought to exist. It is important not to confuse the term error with a mistake in measurement or with uncertainty. Whenever possible, scientists try to correct for any known errors by applying corrections from calibration techniques. Any error whose value is unknown is a source of uncertainty.
Systematic errors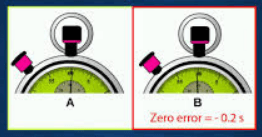
A systematic error is the component of measurement error due to measurement results differing from the true value by a consistent amount each time a measurement is made. In some cases a systematic error leads to a constant offset (a fixed amount in one direction). In other cases, systematic effects are not constant but follow a pattern. The magnitude and direction of systematic effects determine the measurement bias in values obtained. Systematic effects can be caused by influence of the environment, methods of observation or instruments used. It may be possible to reduce or remove systematic errors if their causes can be understood and corrected or removed. For example, checking the zero reading of an instrument during an experiment as well as the start to ensure that it has no zero error. Another example may be checking that the values are read carefully perpendicularly off a ruler, to avoid the parallax error. Even though it may be constant, a systematic error can remain unknown. There are many historical examples of measurement results that were later shown to contain systematic errors.
Random errors
A random error is the component of measurement error due to measurement results varying in an unpredictable way from one measurement to the next. Random variation is present when any measurement is made, and cannot be corrected for. The effect of random variation can be reduced, however by making more measurements and reporting the mean. As they can be random, there is the same probability of the results to fall over the true value than there is that they fall below the true value. By taking as many results as possible and taking the average, this will cancel out these errors giving a pretty close value to the true one. Random variation arises from uncorrelated effects of factors which are not controllable (for example, electrical noise).
Precision and errors
It may be very hard to get your head around the difference between accuracy and precision and the difference between random and systematic errors.

If we consider a dart challenge, we can say that a person is very accurate if the darts end up very close to the true value. This person can although miss completely the true value and still be precise. This can occur when the darts end up very close to each other, they end up in the same point but far away from the centre. This person is precise as it always gets the same point but not so accurate as he was meant to get the centre.
The other problem is instead the difference between systematic and random errors, which are very important and you need to be able to recognise them and differentiate. Random errors come from unknown and unpredictable changes in environment, such as temperature change or air pressure change. You cannot take away a random error, even if you know it’s source (usually), but you can reduce its effects by repeating the experiment and taking an average of the values. A systematic error instead comes from a consistent error in experiment due to a bad calibration of a piece of equipment, such as meter ruler really not showing the correct scale and being


Page written by Luca Quinci – Thank you!
You must be logged in to post a comment.